J.D. Davis = J.D. Martinez?
J.D. Davis is the one hitter that I don’t want to leave any draft without. The 75th overall pick in 2014, Davis quickly became a top 10 prospect of the Houston Astros. His scouting report states that he has a good eye and shows great understanding of the strike zone with plus-plus power, but also with some contact issues. J.D. showed very good power in the minors while improving his contact rate at each level. He had 3 big problems though: he couldn’t play defense, he still had contact issues, and the Astros were really good so they had little need of his services. After about 200 disappointing plate appearances with the Astros from 2017-2018, the Mets finally gave Davis a shot to play close to full-time (eventually) in 2019, paying what was at the time considered to be a pretty hefty price in prospect talent to acquire him.
The results were, in the words of Borat, “GREAT SUCCESS!” In 2019, J.D. hit 22 HR with 65 Runs, 57 RBI, and a .307 AVG in just over 450 plate appearances. He really hit his stride in the 2nd half with 13 HRs and a .335 AVG. A look inside the numbers showed Davis was destroying the ball – and he quickly became a Statcast darling.
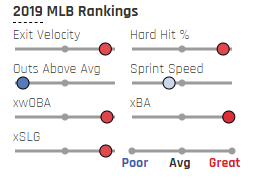
 He posted eye-popping numbers with a hard hit rate of 47.7% (top 9% in MLB), an average exit velocity of 91.4 MPH (top 10%), 114.7 MPH max exit velocity (29th in MLB), expected wOBA (xWOBA) of .383 (top 8%), expected wOBA on Contact (xWOBACON) of .462 (top 8%), Expected Batting Average (xBA) of .308 (top 3%), and 11.4% barrels per batted ball event (52nd out of all MLB players with 200+ batted ball events).

But as exciting as his Statcast numbers are (power was never an issue after all), the truly exciting part of Davis’ profile is his growth as a contact hitter. Since coming to the majors in 2017, his contact rate has improved from 65.9% in 2017 to 72.3% in 2018 and up to 74.6% in 2019 (MLB average was 76%). Concurrently, Davis’ strikeout rate has gone from 29.4% to 25.7% to 21.4% (MLB average was 23%) while his swinging strike rate has gone from 18.1% to 13.9% to 12.4% (MLB average was 11%).

A big reason for the improvement was his whiff rate against breaking pitches, which went from 43.5% in 2018 plummeting all the way down to 31.7% in 2019.

Granted, it’s a small sample size from his 2017-2018 seasons in the MLB, however he seemed to make some real adjustments in AAA in 2018 as he posted his lowest strikeout rate ever at just 18.3% – which appears to have translated to his 2019 success as well. The other big piece of news was that while Davis had always been a lefty-masher, last year he showed he could hit righties just as well.
Detractors will point to Davis’ .307 AVG with a .355 BABIP and say that he’s due some major regression. But is he? It’s been proven that some players have the ability to maintain a high BABIP year after year. Usually it’s the players who are fast and/or hit the ball really hard that are able to do so. Guys like Aaron Judge, Domingo Santana, Christian Yelich, J.D. Martinez, Trevor Story, Javy Baez, Chris Taylor, David Freese, and Mike Trout (other than last season) are a few examples of those who have maintained a high BABIP throughout their careers. A few of these guys both hit the ball hard and are fast like Yelich, Story, Baez, and Trout (prior to last season when his speed score was way down), but guys like Martinez, Judge, Santana, and Freese are either slow or not particularly fast. Davis’ speed score last season (via Ron Shandler’s 2020 Baseball Forecaster) was 103 – which is about average speed, but still faster than some guys on that list. But what we definitely know he does do is hit the ball really hard. J.D. Davis’ Statcast profile was actually eerily similar to J.D. Martinez’s last season as you can see here:
So is J.D. Davis now J.D. Martinez? Probably not. But he might be much closer than you think. And while I do expect some BABIP regression, I don’t expect it to negatively affect Davis’ AVG as much as the projection systems seem to think. ATC has a .274 AVG projection for him while Steamer and Depth Charts are even more pessimistic at .264. After all, his xBA last season was right on target at .308, so clearly the projection systems aren’t buying into Davis’ hard contact profile. I am.
So what’s not to like? Well, despite solving some of his prior problems, he does still have a few issues. Davis’ biggest issue is that due to his butcher-like play in the outfield (or any position) his playing time isn’t guaranteed – in fact, he was often replaced in the late innings last season for defensive purposes. Yet, as of right now, Davis is penciled in as the Mets’ starting LF most days; and, based on where they slotted him last season, he’ll likely hit 5th-6th against righties and 2nd-3rd against lefties. If Davis hits as well as he did last year however, I expect the Mets will keep him in the lineup and even possibly move him up – especially with Cano waning. The Mets have some flexibility with McNeil and Lowrie each able to play several positions, and I expect them to use it.
Another issue is his fly ball rate (30% via FanGraphs), which directly corresponds to his launch angle (10.6 degrees). I don’t have a lot of optimism on the launch angle front though because in 2019, the Mets hired hitting coach Chili Davis, who is not a big believer in launch angles. The results followed, as no team in baseball reduced its average launch angle more than the Mets (by 2.5 degrees) according to Sports Illustrated. In dropping from 13.2 degrees in 2018 to 10.7 degrees in 2019, New York went from ranking 6th in MLB in launch angle to 25th. The good news is that Davis’ fly ball rate skyrocketed from 23% in the first half to 37% in the second half. If he can hold those fly ball gains, 30+ HR should be on the horizon with regular playing time.
With an ADP (courtesy of NFBC) holding steady around 175, J.D. Davis looks like a massive bargain. I’d put him around 25-30 HR with 75-85 Runs 85-95 RBI and a .285-.290 AVG playing close to every day. Though what makes Davis an even bigger steal here is his ability to go beyond that rough projection. If the fly ball gains from the second half of 2019 hold and/or he makes a launch angle adjustment, the results could be 35+ HR and very close to J.D. Martinez type production. This seems all the more reasonable with Citi Field coming in as the 5th best Park Factor for HR for RHH (right-handed hitters) at 1.21 according to Dan Richards at Pitcher List. If he also keeps improving his contact rate he actually could hit .300+ again with how hard he hits the ball. As always, pay for more conservative expectations and hope for more – but at his current ADP there is PLENTY of room for profit. And with J.D. Davis, I think the upside is certainly more easily attainable than it is with others. But if you’re in my league, please ignore everything I just wrote. He was probably just a 1-year fluke, right?


Comments
J.D. Davis = J.D. Martinez? — No Comments
HTML tags allowed in your comment: <a href="" title=""> <abbr title=""> <acronym title=""> <b> <blockquote cite=""> <cite> <code> <del datetime=""> <em> <i> <q cite=""> <s> <strike> <strong>